Designed by function, lived by journey
47%of customers leave after two or three poor interactionsGENESYS ’26

Practices
CX Strategy Design Studio Innovation Lab All 22 Solutions Add-ons Configure your engagementBy role
CMO CINO CTO / CIO CPO CEO & C-SuiteLearn
Whitepapers Knowledge Base Delivery Methodology FAQsTools
ToolKit f/cx.ai Online Tools Template Library Readiness Assessment AmorphiaUI AIDownload
Brochures & Solution Catalog All ResourcesWritten for the CEO and the executive team
Revenue confidence is at a five-year low, the board is pushing faster than the plan, and most AI spend still has no line in the P&L. The one thing that compounds across every function is the experience the customer actually moves through. This is what changed, what the team is measured on, and where f/cx.ai plugs in.
of CEOs are confident about revenue growth — a five-year low
PWC ’26report no significant financial benefit from AI yet
PWC ’26see both cost and revenue gains from AI
PWC ’26say their board is rushing the AI transformation
BCG ’26of a CEO’s own evaluation now rides on AI ROI
BCG ’26of consumers expect your best experience everywhere
GENESYS ’26Bought by function · lived as one journey
Every function is putting AI into the customer path on its own plan, budget and scorecard. The customer meets all of it as one experience. The seams between functions are where value leaks, trust breaks and AI spend loses its return — and no single function owns them.
From the CEO seatSix functions each report progress on their own number while one customer moves through all of them.
Six plans, six AIs, six numbers. One customer falls through the seams. One experience graph under every function. The seams become designed handoffs.
Three failures underneath it
What f/cx.ai does instead
f/cx.ai is a customer experience design and innovation agency built to own the seams — one direction, one model, one measure.
Across every function that touches the customer — strategy, research, design and AI in the path, from one agency.
The ToolKit puts the same evidence and visible weights in front of every seat.
Gates and a measurement frame agreed up front, so year two survives.
AI adoption × customer experience
Pick a pressure on the map — each gauge is the figure behind it
Only 30% of CEOs are confident about revenue growth, down from 38%, while 42% name the pace of transformation their top concern. Every bet now argues against a smaller appetite for risk.
Caution priced into decisions that needed conviction.
56% report no significant financial benefit from AI so far and only 12% see both cost and revenue gains — while just 11% connect AI impact to financial reporting at all.
A second year of investment argued on belief rather than evidence.
61% of CEOs say their board is rushing the AI transformation, nearly 40% say it lacks an informed view of AI’s effect on growth, and over half say it misjudges the gap between hype and reality.
Commitments made in the boardroom that the organization cannot hold.
CEOs put 35% of their own performance evaluation on AI ROI. Their boards put it at 27%. The eight-point gap is itself the alignment problem, before a single project is discussed.
Two different definitions of success in the same review.
61% name executive misunderstanding of AI as the leading cause of misalignment, and nearly a third report executives and practitioners working from different AI strategies.
Each function hitting its own number while the journey still fails.
92% of consumers expect the best experience they have had anywhere, and 47% leave after two or three poor interactions. Experience is the differentiator that compounds across every function.
Share lost to a competitor with less friction, not a better product.
The other half of the data — What separates the 12%
more likely to report meaningful AI returns, where the foundations are strong
higher profit margin at companies applying AI broadly rather than in pilots
more likely, among high performers, to have embedded AI in products and decisions
of CEOs name customer service and experience as where AI impact is already measurable
Read it as one sentence. The commitment is made and the return is not, and the difference between the twelve percent and everyone else is foundations, breadth, and measurement designed before the spend — decided journey by journey, across functions, rather than function by function. That is a design and decision problem, which is the work f/cx.ai does.
Five books, one composite
The enterprise scorecard did not shrink to make room for AI. Growth and margin stayed, customer value and AI return were added, and trust became a reporting line. These are the measures the board reads together, and the constraint that breaks each one.
Pick a book on the ring for its measures and the constraint that breaks it
Acquisition outruns the experience that has to keep the customer.
Cost is moved between functions rather than removed from the journey.
Satisfaction is reported as a score with no P&L line attached.
Measurement is designed after the build instead of alongside the spend.
Risk is consulted at launch, so the gate becomes a veto rather than a criterion.
One model, eight arguments it settles
Pick a seat — one model settles a different argument for each
The CX conversation reaches the board as a business argument with numbers attached.
Brand promise and delivered experience measured as a single number, not two.
The moments that decide whether a customer stays, ranked by gain per engineering week.
The platform conversation starts from journeys, so integration debt is known before signature.
Capacity from removing avoidable work rather than staffing to the worst forecast.
Every cycle ends in scale, iterate, or stop, and wrong ideas die cheaply.
Arbitration stops being a contest of opinions; the evidence decides and the decision holds.
An investment argument that survives its second year, because measurement was designed with the spend.
Start where the decision is
Pick a line to ride it into the gates
Not a presentation. One honest baseline for what AI can and cannot do across your experience, and a ranked shortlist the room built itself.
Contact drivers, journey mapping, and a data and platform audit, ending in one ranked backlog the leadership team can argue with instead of five wish lists.
Who owns the customer outcome — decision rights, funding routes, and the forums that decide whether a strategy survives its first quarter.
Senior CX and AI direction in the room at the moment decisions are made, without a full-time hire or an agency bench underneath it.
Proprietary f/cx.ai IP
Twenty-two working decision-intelligence modules that move an engagement from nobody agrees what is true to a gated roadmap a board can fund. Not a deck — live models your team operates in the room, that change answers when an input changes, and that stay with your people when we release.
Hover a node, change the phase, or open the whole graph
What is actually true. The baseline nobody argues with.
A ranked value-leak list, each item traced to its evidence.
What we intend instead. Options tested before the expensive commitment.
A designed AI handoff, including the failure path — and the concepts that did not survive.
What we will and will not do. The phase clients skip.
A weighted ranking you set the weights for, and a not-this list with an owner.
What the board can fund. Sequence, gate, measure, hand over.
A gated roadmap, a measurement frame agreed before anything is built, and the model itself.
Inside the ToolKit
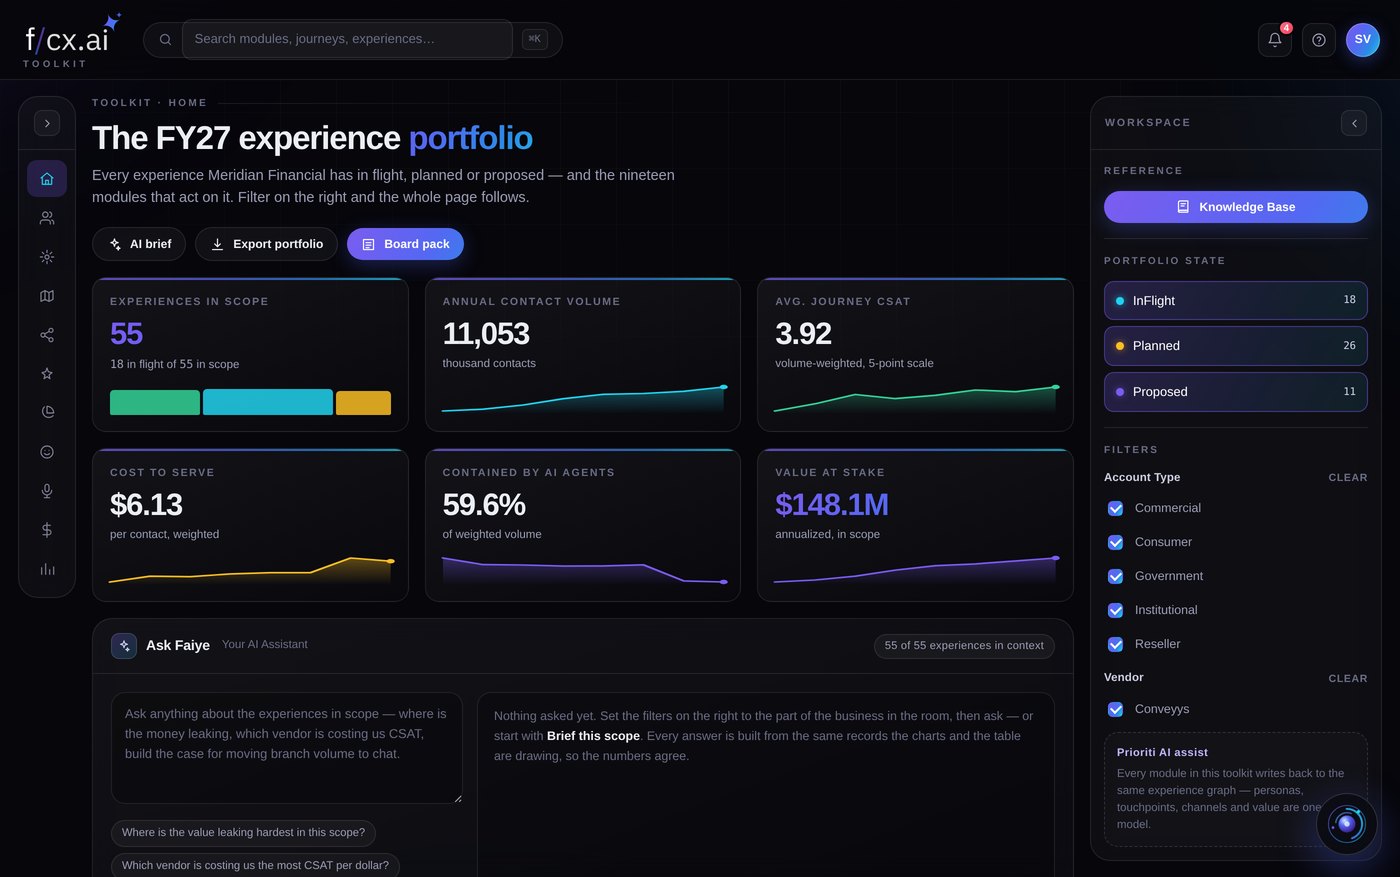

One view of every experience in flight, planned and proposed — volume, cost to serve, satisfaction, and the signals that should change what gets funded next quarter.
A ranked list of the decisions worth making this quarter, each with value at risk and model confidence attached.
Session one, every engagement. The fastest way to find out whether the client’s numbers agree with each other.
Every live experience by channel and persona, with the touchpoint events moving the numbers and the four measures the executive team actually asks about.
A defensible read on which programs are progressing and which are quietly degrading.
Steering committees and monthly reviews — it turns “how is it going” into a specific conversation.
The people the experience is actually for — each persona traceable to research, with needs, tasks and channel preference, scoping every other module.
A validated persona set the whole organization can name, with the research base behind each one.
Before any journey work. If the client cannot agree who the journey is for, nothing downstream survives review.
The journey as the customer experiences it — every touchpoint, what they are thinking, and where sentiment, effort and cost diverge from what the organization believes.
A journey map with evidence attached to every stage and the leak points quantified.
Discovery workshops. The sentiment-versus-belief gap is usually the moment the room changes its mind.
Who the base actually consists of, what each segment is worth, and which submarkets have no owner — click a segment and the whole page scopes to it.
A segment model with value index, coverage gaps and behavioral indices per segment.
Whenever growth targets and service design are being argued in different rooms.
Market and product sentiment across tracked dimensions, six months of movement, and the strategic landscape behind the scores.
A banded sentiment map showing where a category is still open, with evidence per dimension.
Competitive and category work — the weakest scores are usually where the opening is.
What customers are telling you, clustered and weighted, and where in the journey the telling turns into leaving.
Verbatim clusters ranked by volume and sentiment, tied to the journey stage they belong to.
When the client has plenty of listening and no synthesis — which is most of the time.
Point it at any experience asset — an interface, a website, a product, a portal, a digital journey or a service touchpoint — and it runs a structured AI audit end to end, scoring against the framework’s criteria and attaching a validated reference to every recommendation.
A decision package rather than a findings report: what is wrong, what to do, what it is worth, what inaction costs, and in what order — packaged for a formal accept-or-decline.
First contact with an existing experience, and the module most leadership teams reach for first. The fastest route from “this needs work” to a sequenced plan an executive can approve.
The journey as a policy rather than a map. The engine scores every candidate action across marketing, sales, commerce and service and selects the next best one in real time, for each customer, on every event.
An orchestration policy — the weights, the guardrails and the action mix they are willing to run — plus the value gap against their current fixed journeys.
When the client wants AI to run the journey rather than decorate it. The live race against their fixed journeys is usually what settles the argument about whether adaptive is worth it.
The orchestration behind the journey — every automated step, every handoff to a person, every exit. Drag to rearrange; connections and throughput follow.
A working orchestration model with throughput and loss at every step.
Designing agentic service. It makes the handoff design visible before anyone builds it.
How the same customer moves between channels — the handoffs that carry context, the ones that do not, and what each switch costs to serve.
A current-state and designed-state channel model with the cost of unnecessary switching quantified.
Cost-to-serve conversations. The switching matrix usually pays for the engagement on its own.
One idea, every credible way to build it, and the evidence for each — select the variants worth a two-week prototype sprint.
A sprint plan with criteria agreed before the build, and the economics of the answer.
Innovation cadence work. It is how a good idea stops being one person’s conviction.
Every finding, what it would take to fix, and what fixing it is worth — select recommendations and watch the composite move.
A scored recommendation set with gain per engineering week, ready to defend.
Building the funding case. The argument gets made here rather than in the meeting.
Where each capability operates today, where next year needs it to be, and the honest distance between the two across six maturity levels.
A capability-by-capability maturity read with the gap named and sequenced.
Executive briefings. Most organizations stall at Align — this is where they find out if they have.
Ten CX success drivers scored against a peer benchmark, weighted so the drivers that decide outcomes move the composite most.
A weighted composite against peer median, with strengths to hold and the constraints that decide next year.
Assessment delivery. Drag a score in the room and the radar answers immediately.
The same portfolio scored twice — once by the function that owns the customer, once by the function that owns the systems. The gaps are the agenda.
A value-versus-risk portfolio map plus a ranked list of where the two functions genuinely disagree.
When a program is stuck and nobody will say why. A two-point gap is a different-outcomes problem.
Where the experience opportunity is hottest set against whether the organization is ready to act on it — the gap between the two is the planning input.
An opportunity-versus-readiness map that separates capability investment from experience investment.
Portfolio planning across business units or sectors.
Every candidate feature scored on the same five criteria with the weights visible — move a weight and the ranking re-sorts live.
A ranked, weighted portfolio and a visible funding line.
The prioritization session. Agree the weights first; the list is then arithmetic, not politics.
Every initiative scored against the same alignment criteria — customer, business and technology — so the portfolio is argued on evidence rather than enthusiasm.
An alignment matrix with a defensible score per initiative and a not-this list that holds.
Whenever a client is running experience programs in isolation from the strategy.
The sequence, the decision gates and the dependencies — a roadmap the board can fund and the organization can execute in order.
A gated roadmap with investment by workstream and the dependencies that actually threaten it.
The last third of every engagement, and the artifact clients circulate most.
The measure a CFO will accept — value per customer moved by things the organization controls, with the employee data that predicts it sitting alongside.
A defensible RoX index and the leading indicators behind it.
Value realization and renewal conversations.
The practice network — what other people working the same problems are publishing, and the threads worth following.
A live channel between the client’s team and the f/cx.ai practice after the engagement ends.
Handover. Capability that lives with their people needs somewhere to keep growing.
One experience graph
Every module reads and writes the same model, so nobody re-keys a number or argues from a different spreadsheet. That is what “one experience graph” means in the room.
Built for the executive room
Every panel is live — pick two seats, move a weight, drag a driver
One portfolio, scored by two seats at the table. Choose which two, and the distance between their scores is what the next meeting is actually about.
The gaps are the agenda.
Value × risk, scored by two seats
One view of every experience in flight, planned, and proposed — volume, cost to serve, satisfaction, and the signals that should change what gets funded next.
The decisions worth making this quarter, ranked.
Value at risk · model confidence
Where each capability operates today, where next year needs it to be, and the honest distance between the two across six maturity levels.
Most organizations stall at Align.
Capability by capability
The sequence, the decision gates, and the dependencies — a roadmap the board can fund and the organization can execute in order.
The artifact clients circulate most.
◆ = decision gate
Value per customer moved by things the organization actually controls, with the leading indicators that predict it sitting alongside.
The measure a CFO will accept.
Index + leading indicators
Eight outcomes, not eight deliverables
The executive team signs a single experience strategy rather than tolerating four.
The CX conversation reaches the board in revenue, cost, and risk.
What AI can and cannot do here, evidenced, so the pace stops being a guess.
Measurement designed at the same time as the spend, so year two survives.
The same evidence in front of every seat, so arbitration stops being political.
Gates agreed in advance, and a written not-this list with a named owner.
Guardrails and evidence built in, so governance stops arriving as a veto.
The experience graph and scoring model stay with your people when we release.
Sources. PwC 29th Global CEO Survey 2026; BCG 2026 CEO and board AI survey; EY 2026 CEO Outlook; Adobe 2026 AI and Digital Trends; Genesys 2026 State of Customer Experience.
f/cx.ai is a customer experience design and innovation agency for the AI era, working with enterprise organizations to design, prototype, and prove the journeys, service models, and AI agents their customers actually move through. Market figures cited are drawn from published industry research and are shown for context, not as a projection for any one organization. Engagement timing is set by scope and complexity and confirmed at scoping. ToolKit module outputs shown in any f/cx.ai material are illustrative and are not any named client’s results.